The (inequitable) impact of rising tides on NYC
by Monica Hersher
Spatial Analysis and Visualization Initiative (SAVI) at Pratt Institute
Rising sea levels and changing weather patterns mean an increasing area of New York City Is likely to flood.
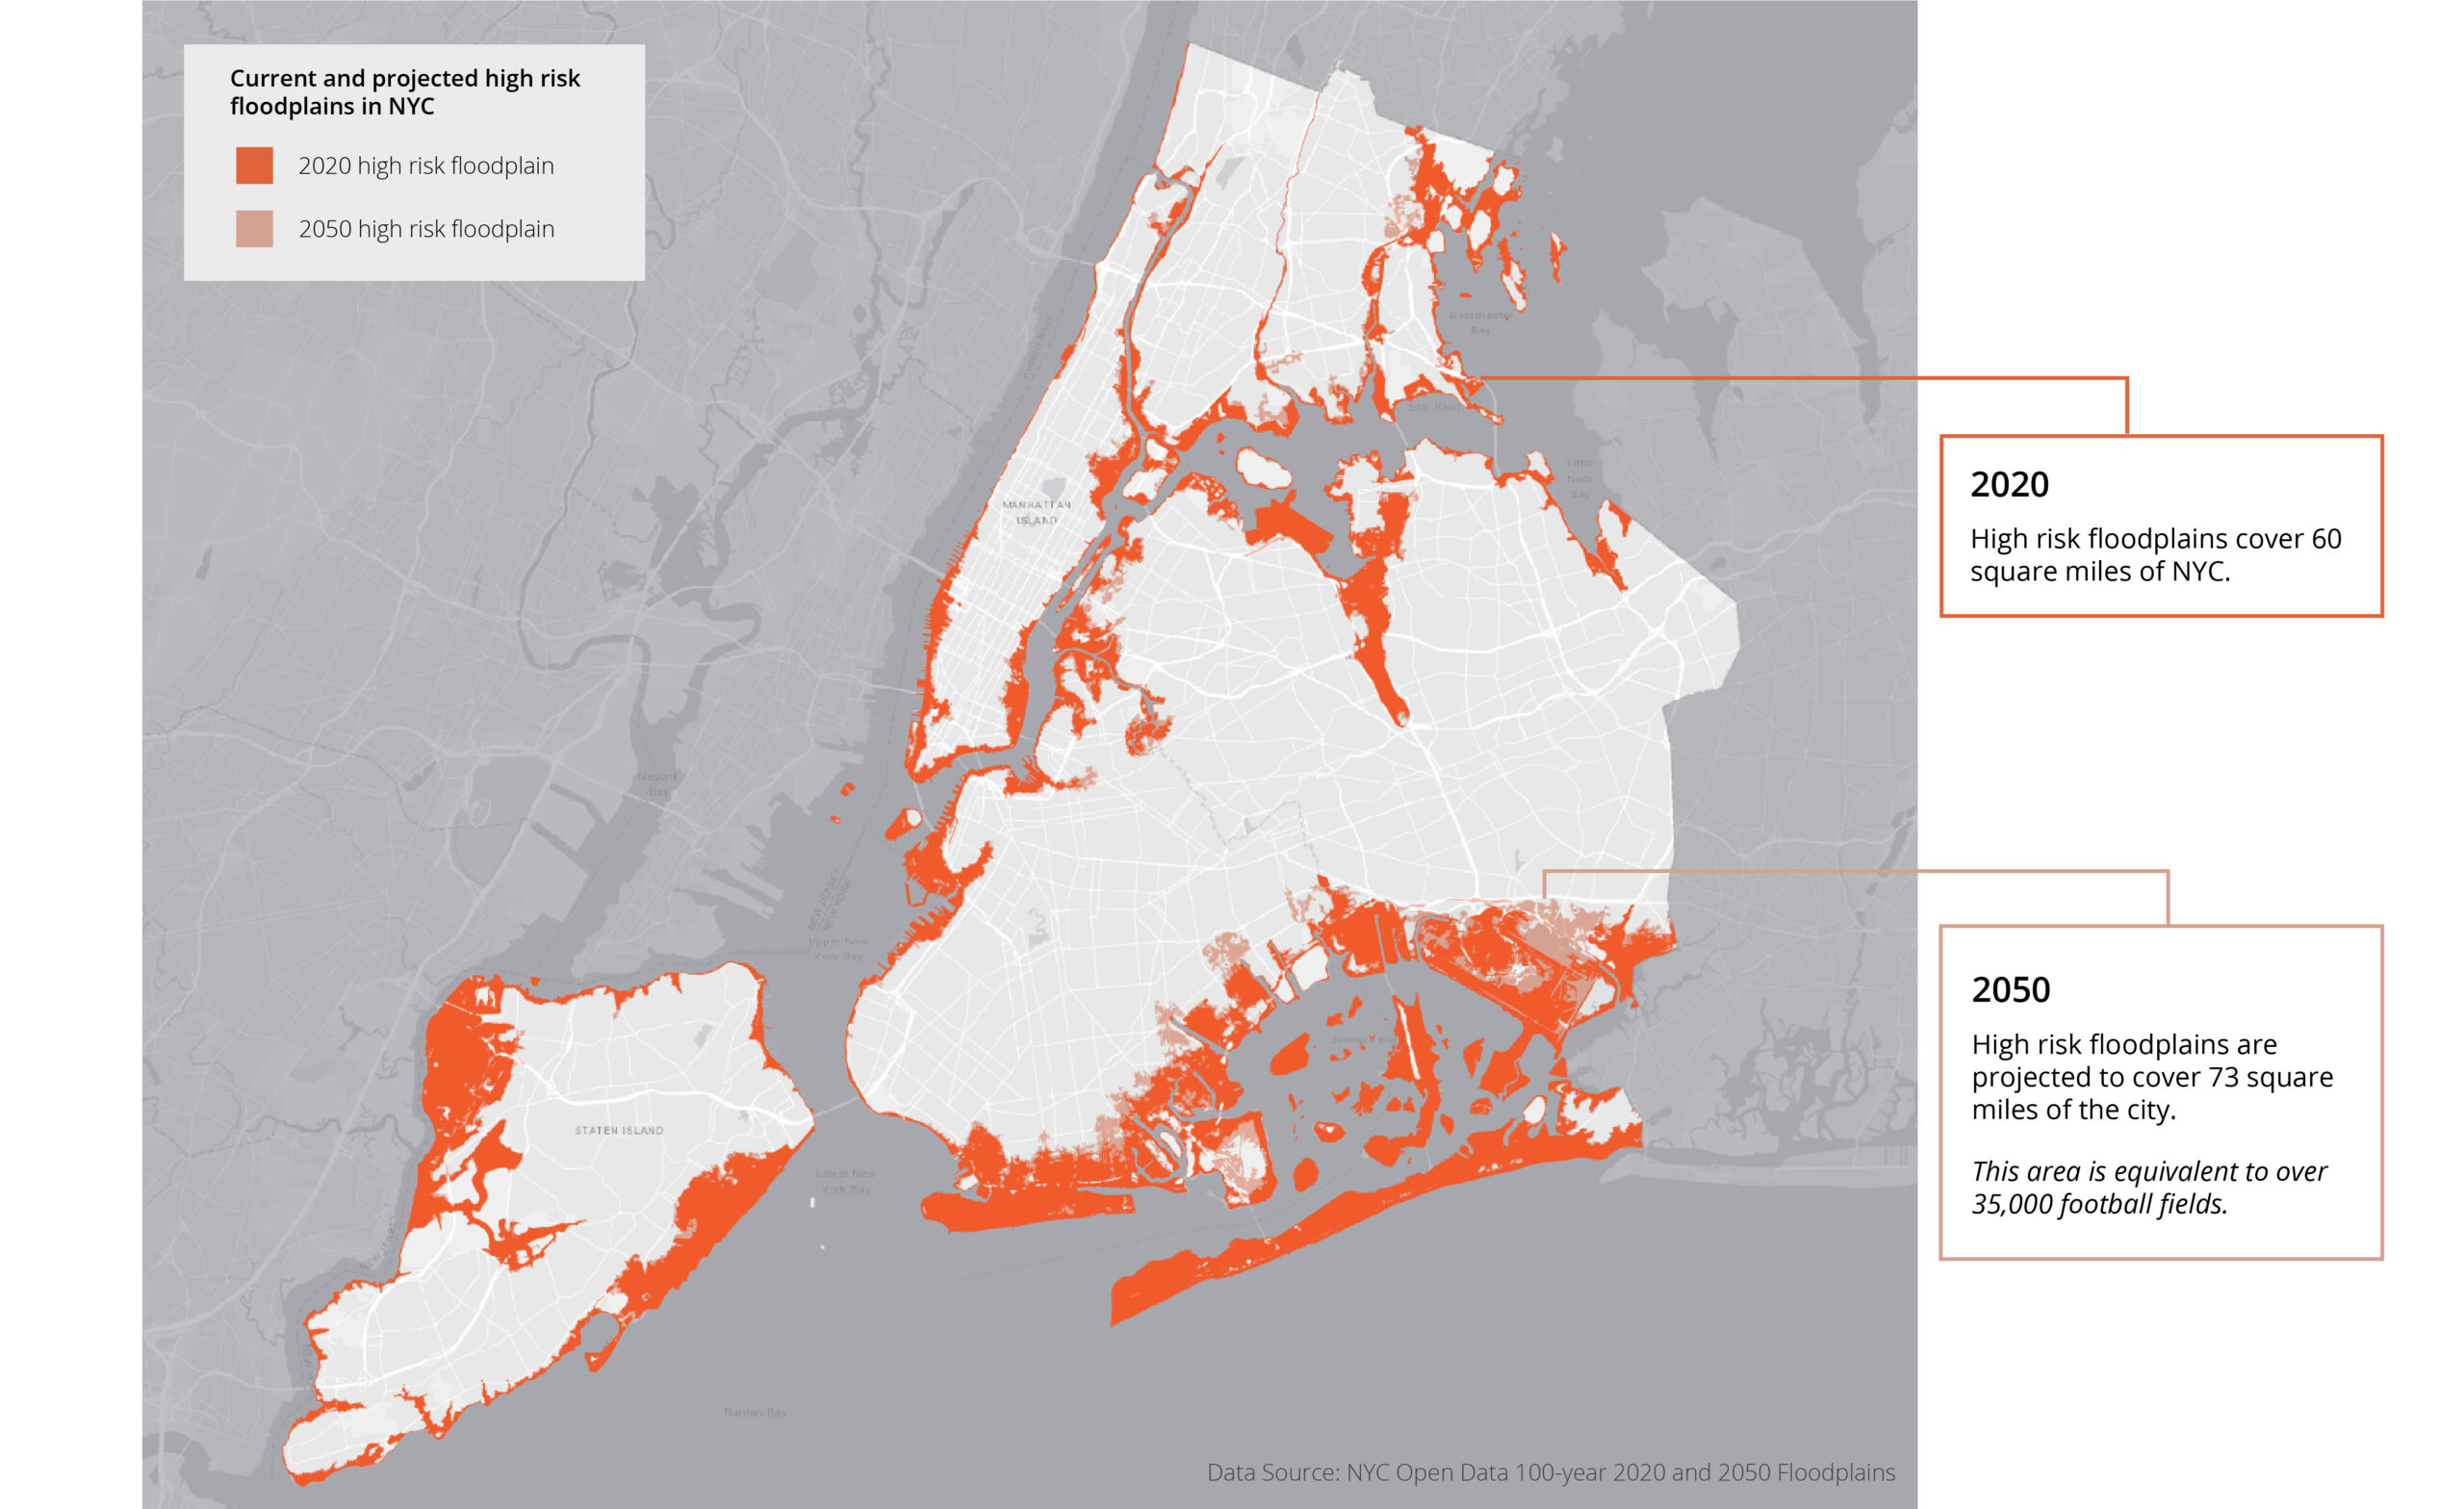
These 100-year floodplains are published by the Mayor’s Office of Long-Term Planning and Sustainability (OLTPS) on behalf of CUNY Institute for Sustainable Cities (CISC) and the New York Panel on Climate Change (NPCC).
2020 High Risk Floodplain, NYC Open Data
– https://data.cityofnewyork.us/Environment/Sea-Level-Rise-Maps-2020s-100-year-Floodplain-/ezfn-5dsb
2050 High Risk Floodplain, NYC Open Data
– https://data.cityofnewyork.us/Environment/Sea-Level-Rise-Maps-2050s-100-year-Floodplain-/hbw8-2bah
The risk in these floodplains is serious.
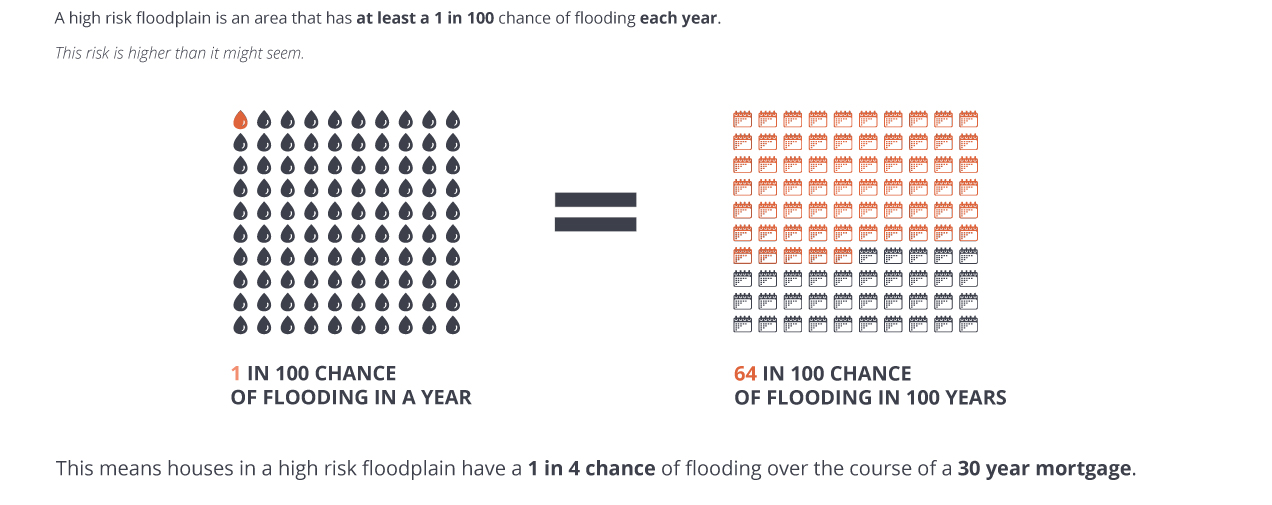
FEMA defines a high risk floodplain as an area that has at least a 1 in 100 chance of flooding each year. Using the rules of compound probability you can then calculate that the probability of a high risk floodplain flooding at least once in 100 years is:
P(doesn’t flood at all in 100 years) = 1-.99100 = .64
Similarly the probability that a high risk floodplain floods at least once in 30 years is 1-.9930=.26.
1.9 million New Yorkers call the 2050 high risk floodplain home.
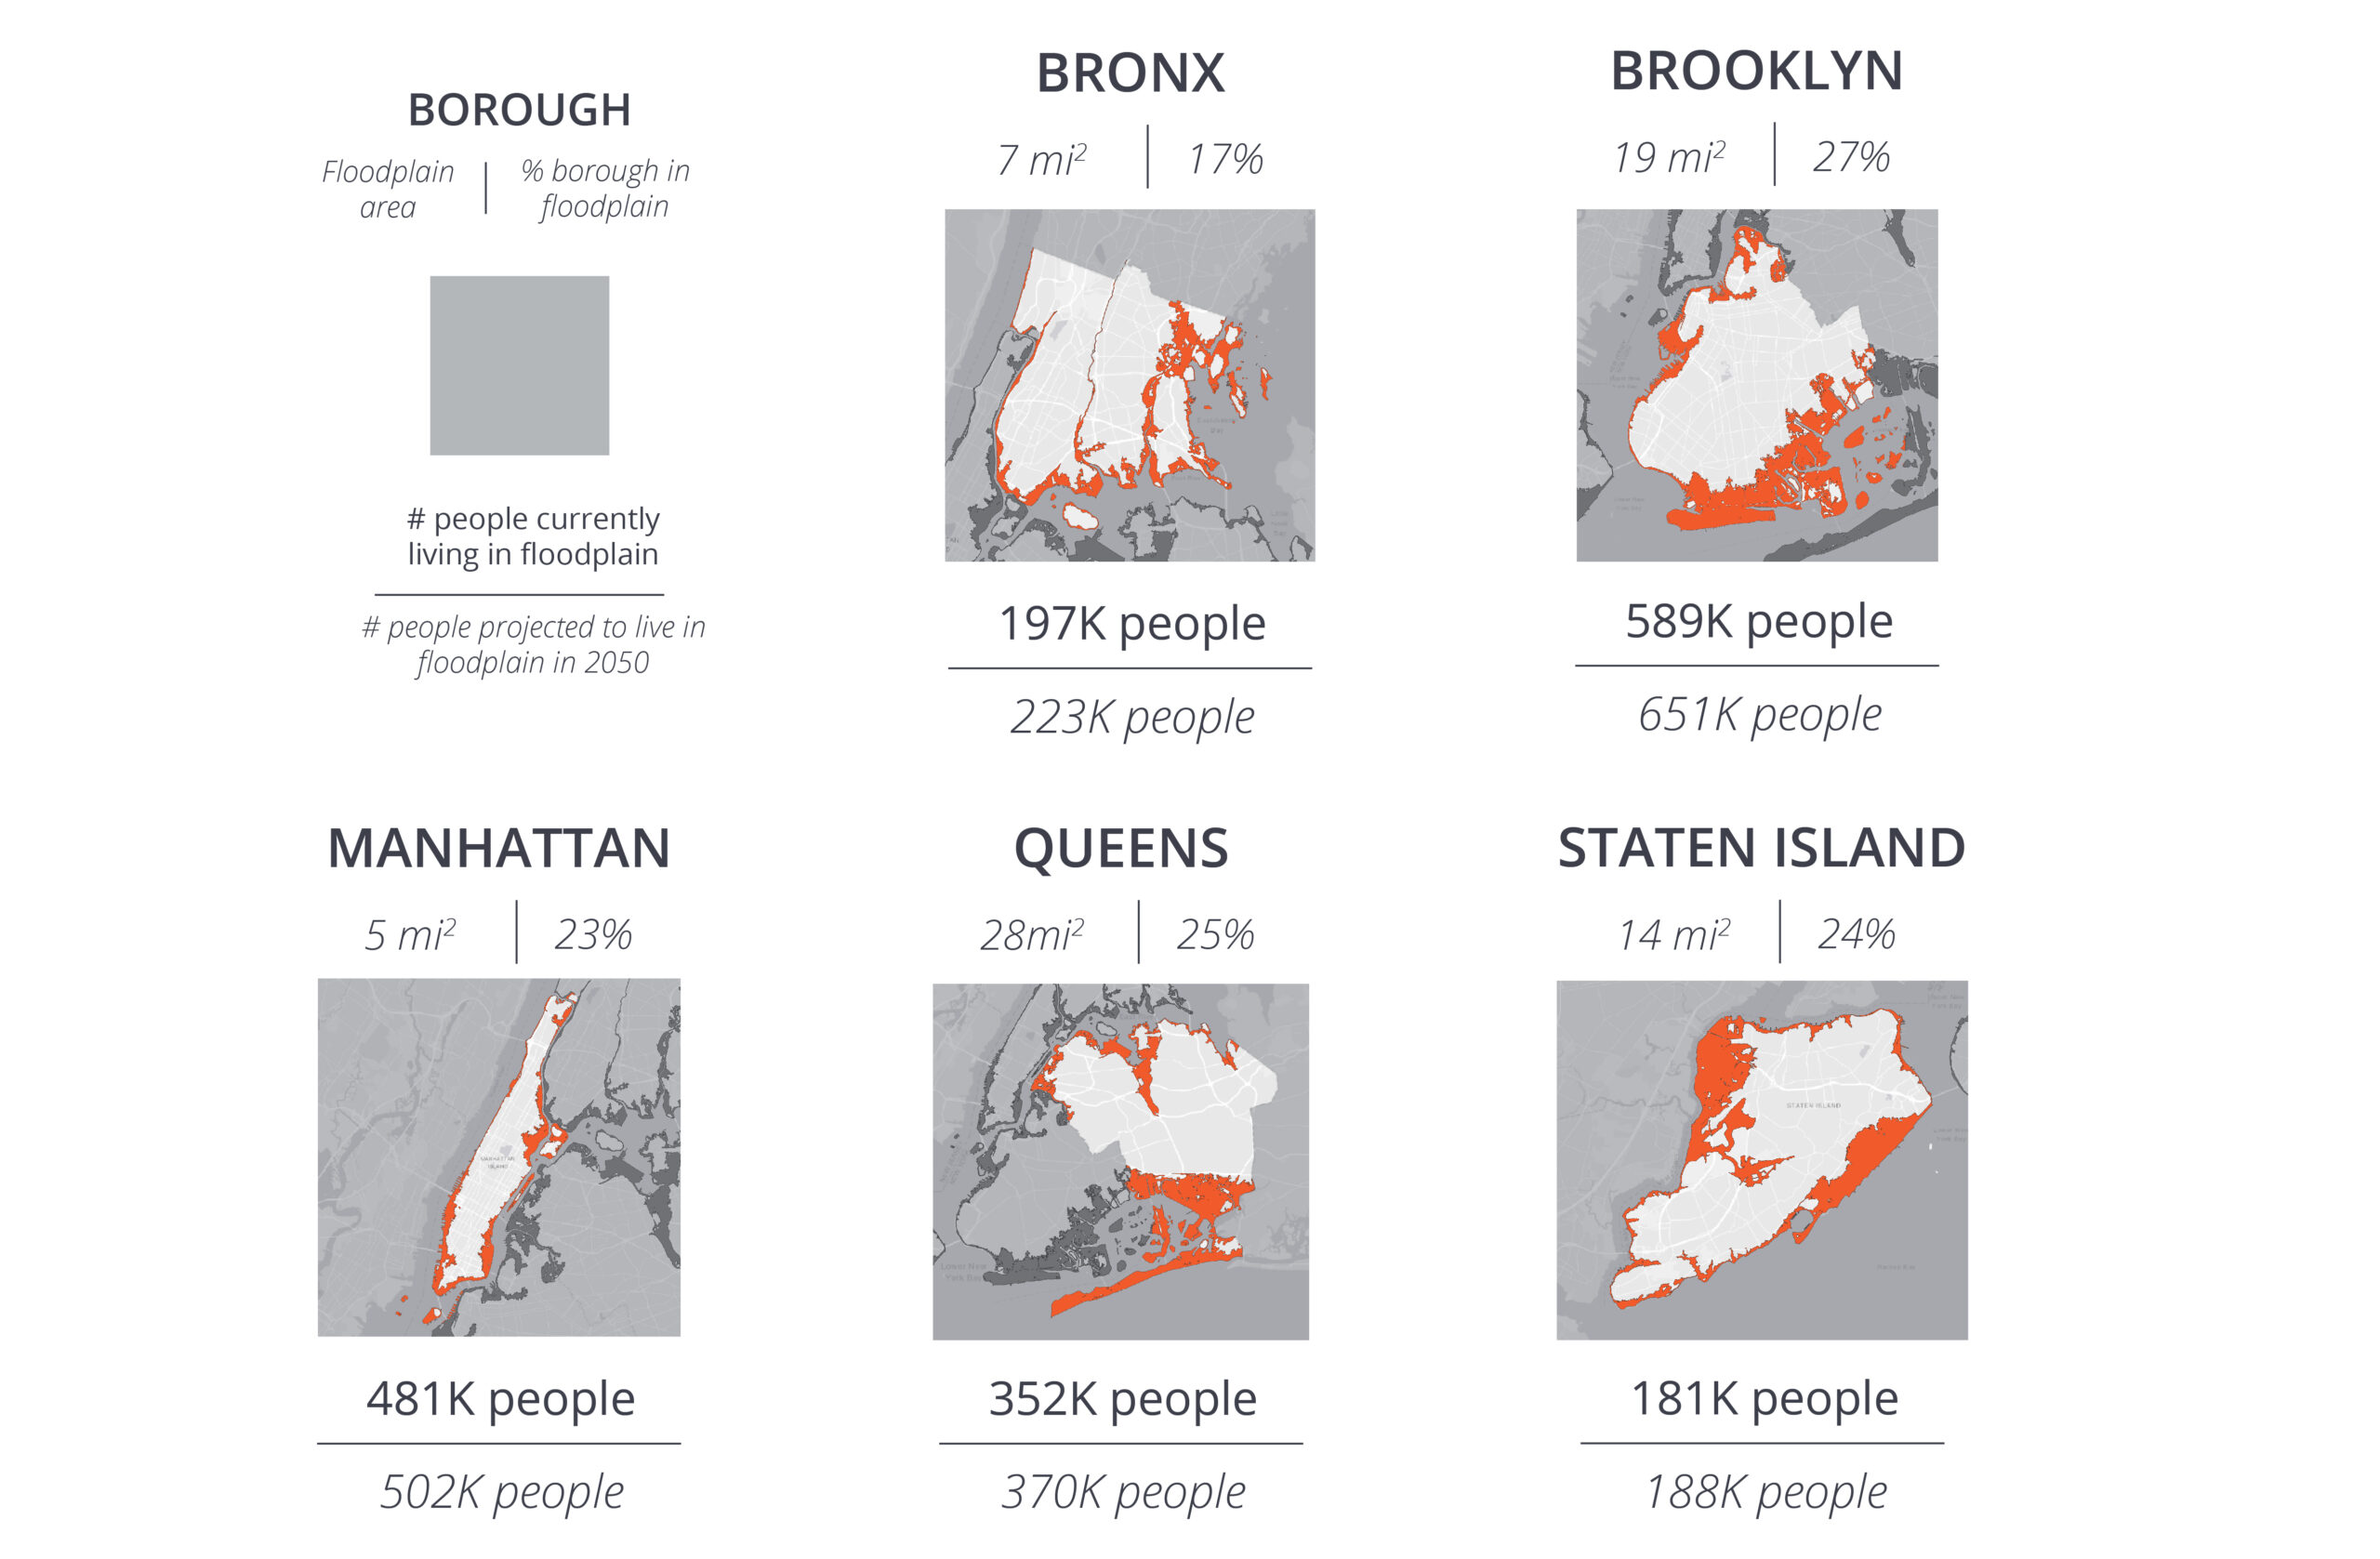
1. 2050 High Risk Floodplain, NYC Open Data
https://data.cityofnewyork.us/Environment/Sea-Level-Rise-Maps-2050s-100-year-Floodplain-/hbw8-2bah
2. 2010 Census Data, Population Variable P001001 at Block Group Level
Data.census.gov, see below for download link
3. Borough geometries (inverted for formatting), NYC Department of City Planning
https://www1.nyc.gov/site/planning/data-maps/open-data.page#district_political
4. 2010 Census block group shapefiles, NYC Department of City Planning
https://www1.nyc.gov/site/planning/data-maps/open-data.page#district_political
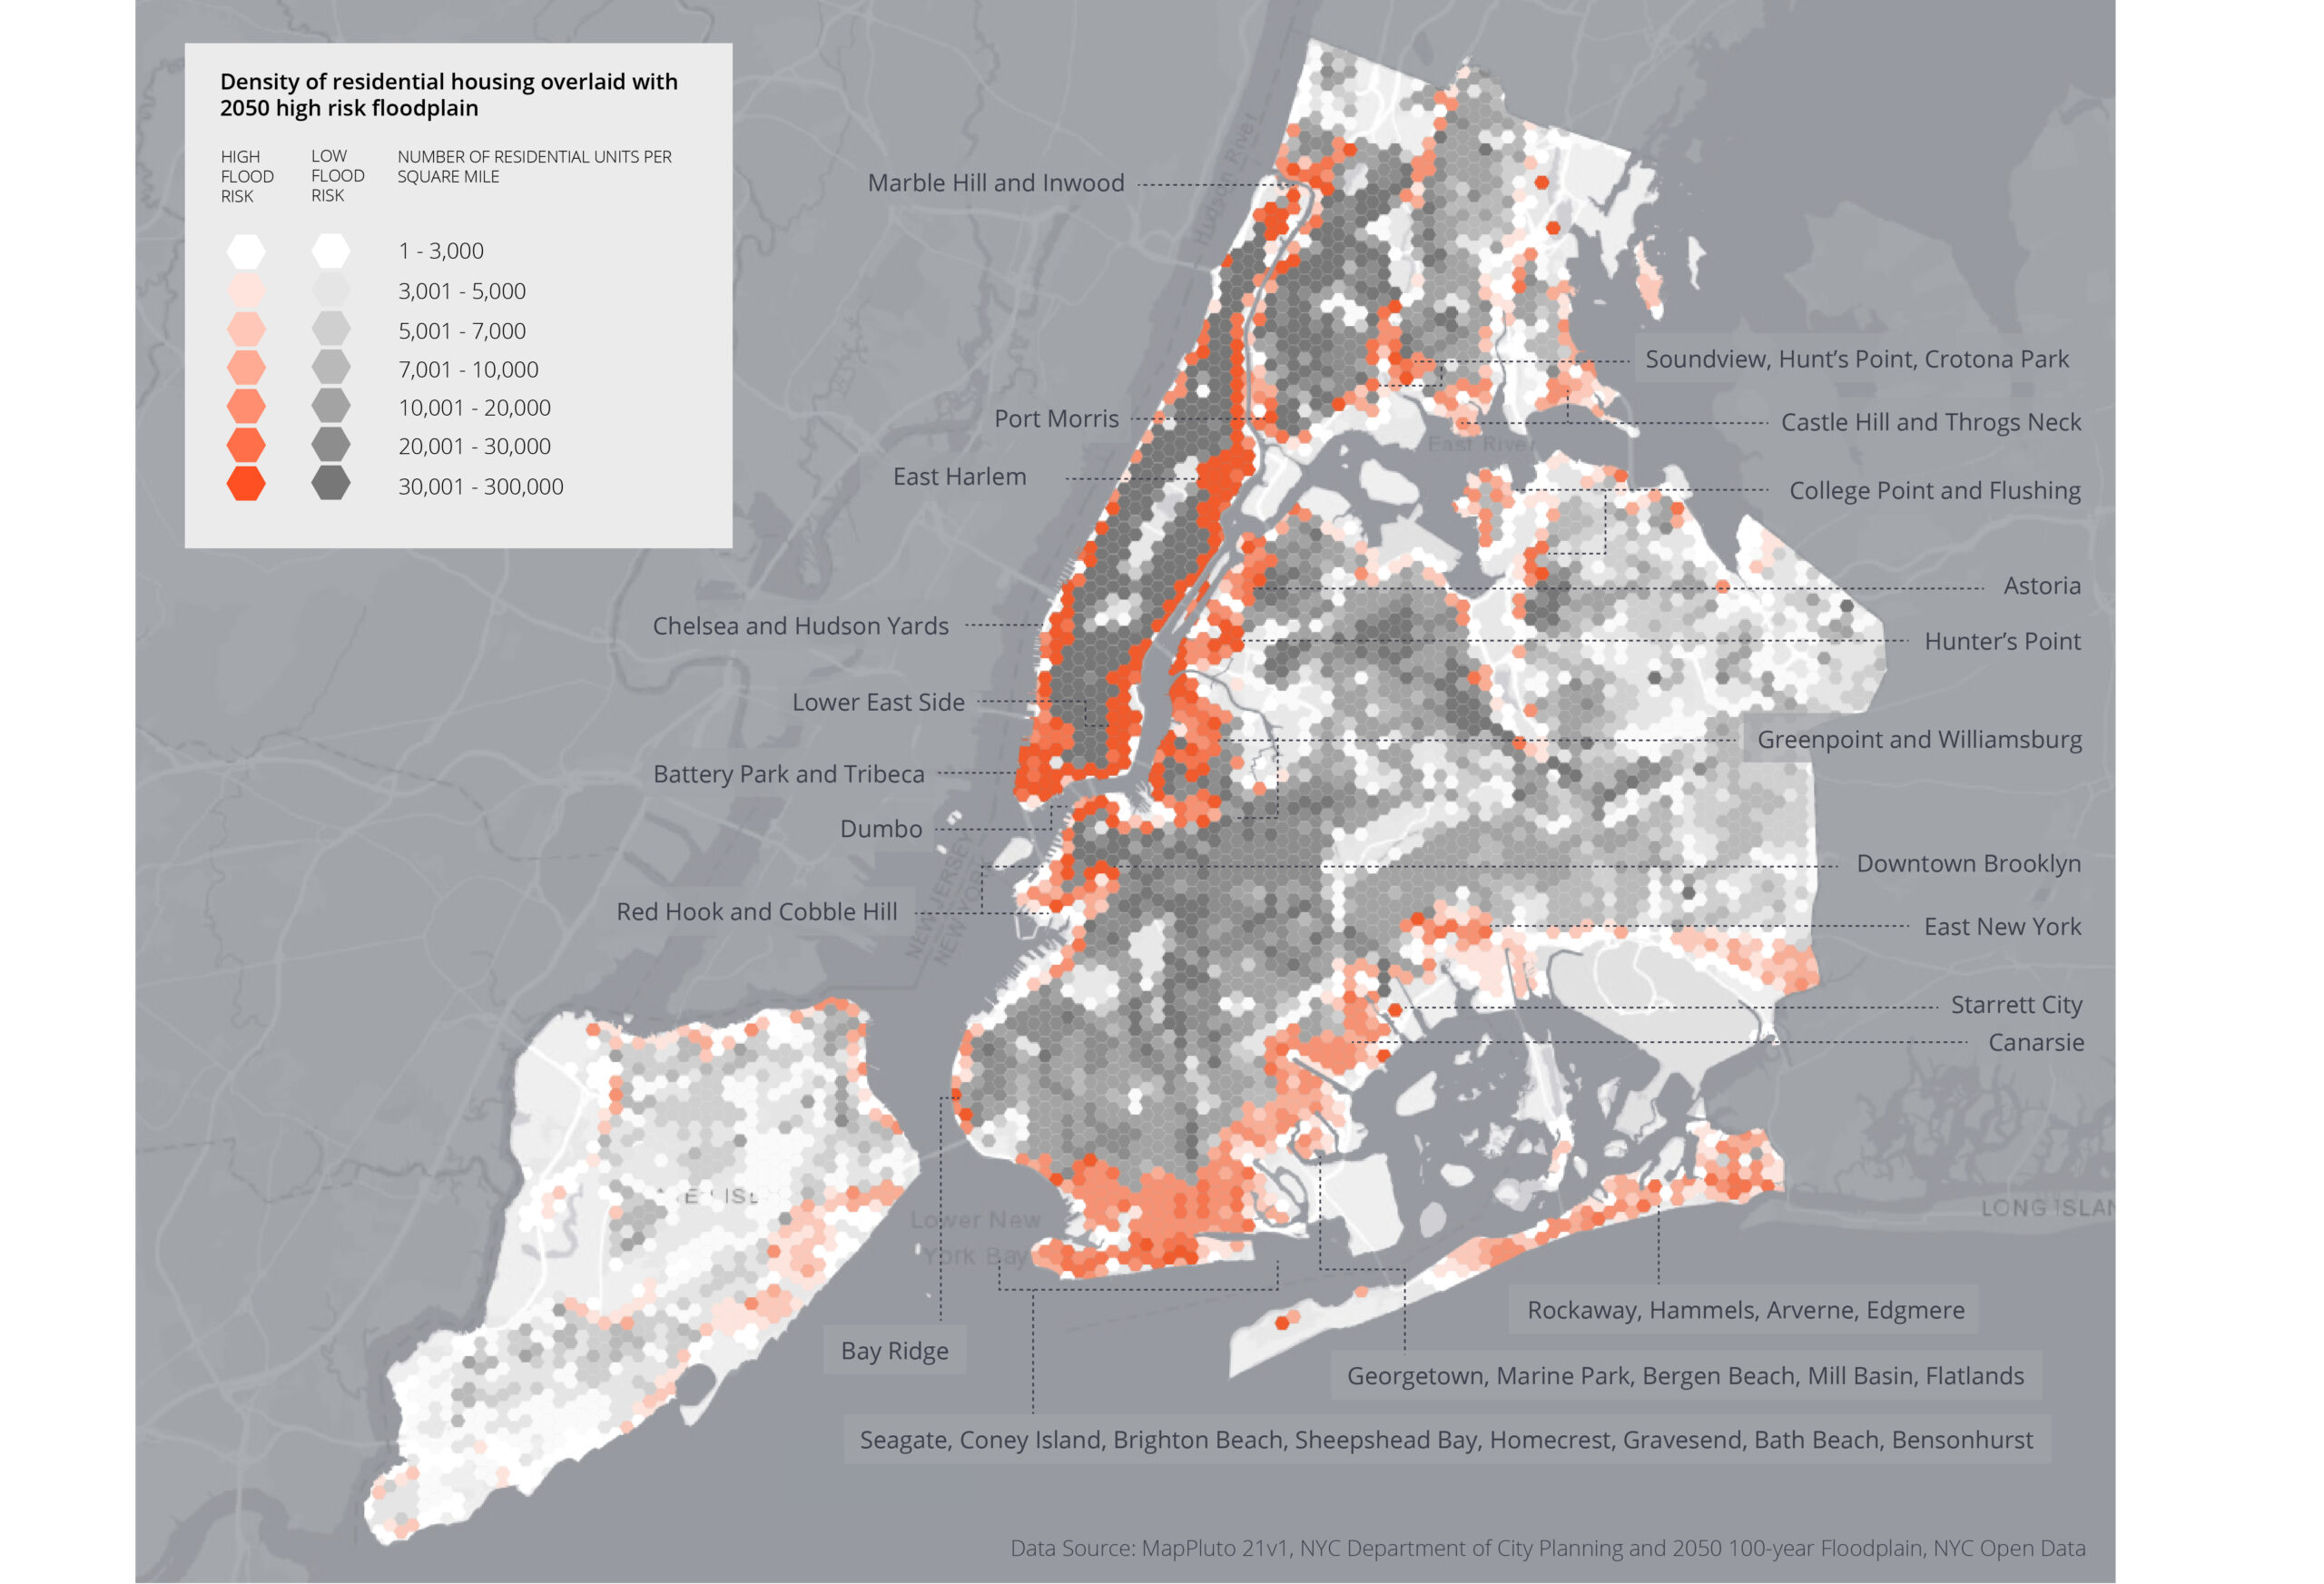
These New Yorkers live in residential neighborhoods that crowd the New York City coastline.
Across most of the city’s coast, tens of thousands of apartments per square mile are likely to flood in the next century. Yet contractors continue to build up these residential communities. In Brooklyn Community District No. 2, the area that contains Williamsburg and Greenpoint, 20,000 new residential units have been constructed in the past decade. These neighborhoods, and the flood risk in them, are only projected to continue to grow.
1. MapPluto 21v1, NYC Department of City Planning
https://www1.nyc.gov/site/planning/data-maps/open-data.page#pluto
https://www1.nyc.gov/site/planning/data-maps/open-data.page#district_political
3. 2050 High Risk Floodplain, NYC Open Data
https://data.cityofnewyork.us/Environment/Sea-Level-Rise-Maps-2050s-100-year-Floodplain-/hbw8-2bah
4. Neighborhood Tabulation Areas, NYC Department of City Planning
– Original source: https://www1.nyc.gov/site/planning/data-maps/open-data.page#district_political
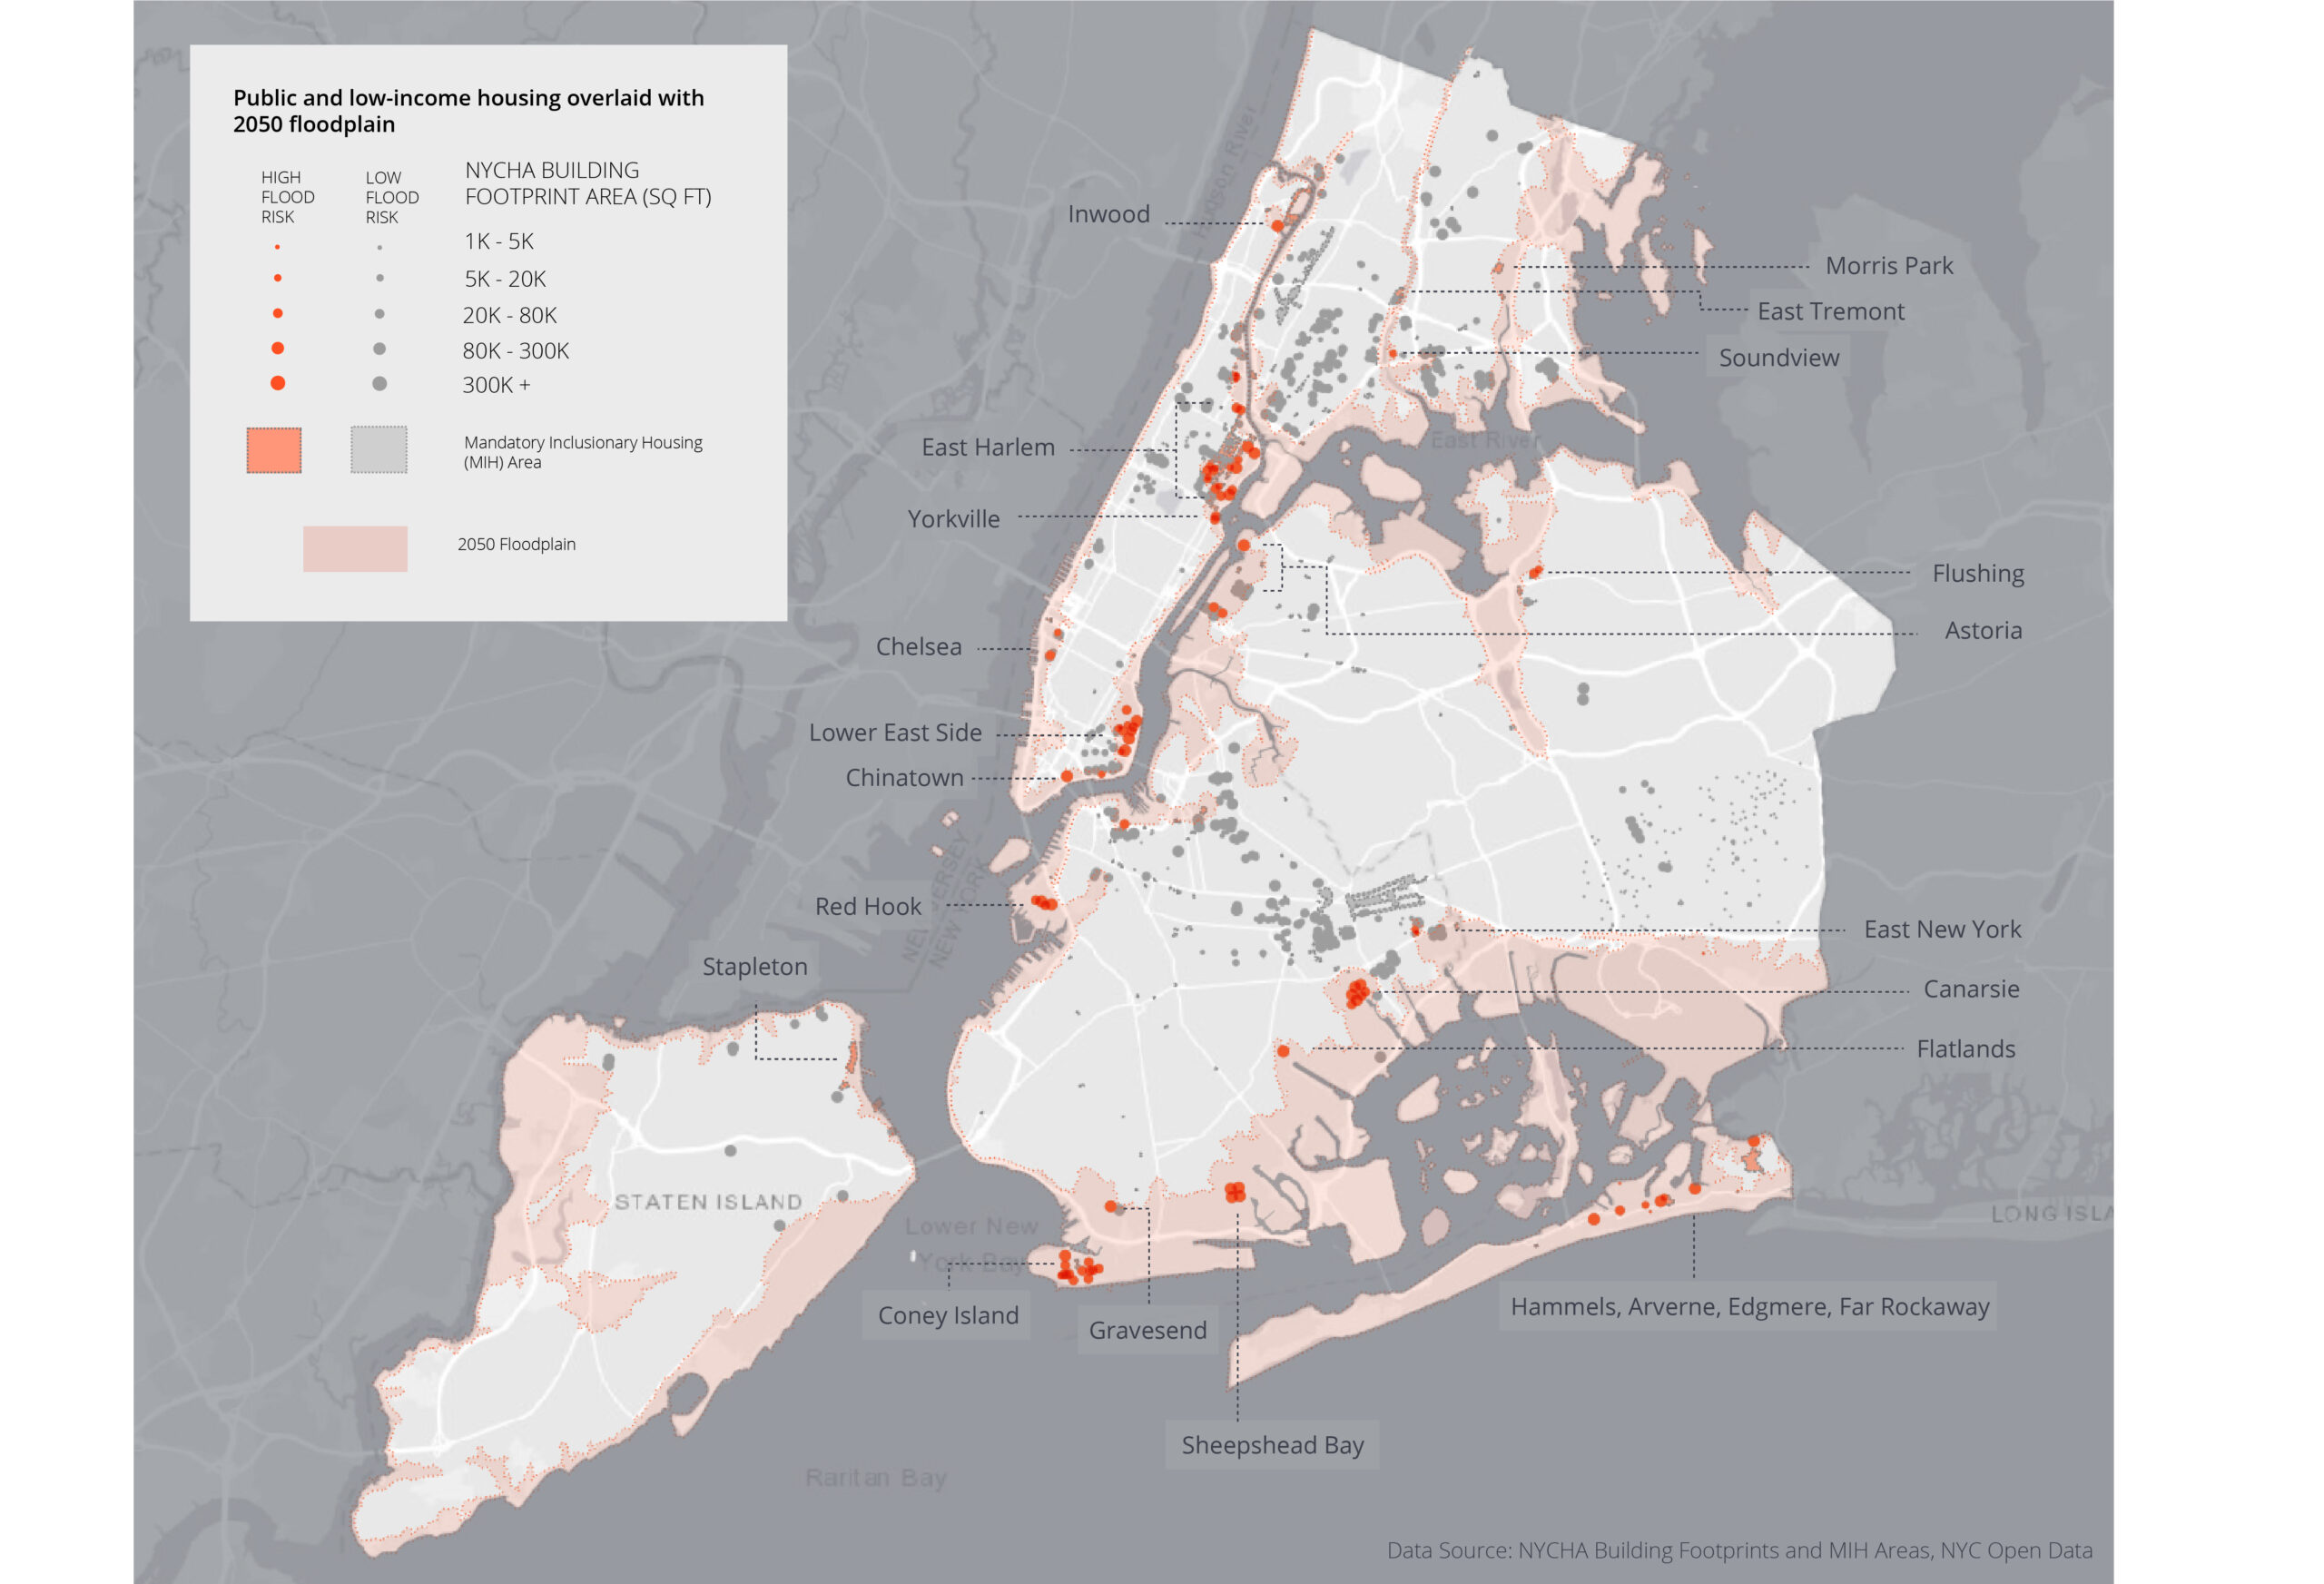
Approximately 41,000 public housing units fall in these high risk coastal neighborhoods.
The environmental threat to affordable housing is particularly serious in Manhattan, where almost all NYCHA buildings in the southern half of the peninsula are likely to flood. Large NYCHA complexes in Coney Island, Canarsie, Red Hook, and the Rockaway region are also compromised. Apart from complexes available in central Brooklyn, NYCHA residents in the floodplain would need to relocate to northern Manhattan, the Bronx, or eastern Queens to stay within public housing. This could have a serious impact on job prospects and commuting time.
1. NYCHA Building Footprints, NYC Open Data
https://data.cityofnewyork.us/Housing-Development/Map-of-NYCHA-Developments/i9rv-hdr5
2. Mandatory Inclusionary Housing (MIH), NYC Open Data
https://data.cityofnewyork.us/Housing-Development/Mandatory-Inclusionary-Housing-MIH-/bw8v-wzdr
3. Borough geometries, NYC Department of City Planning
https://www1.nyc.gov/site/planning/data-maps/open-data.page#district_political
4. 2050 High Risk Floodplain, NYC Open Data
https://data.cityofnewyork.us/Environment/Sea-Level-Rise-Maps-2050s-100-year-Floodplain-/hbw8-2bah
6. Neighborhood Tabulation Areas, NYC Department of City Planning
https://www1.nyc.gov/site/planning/data-maps/open-data.page#district_political
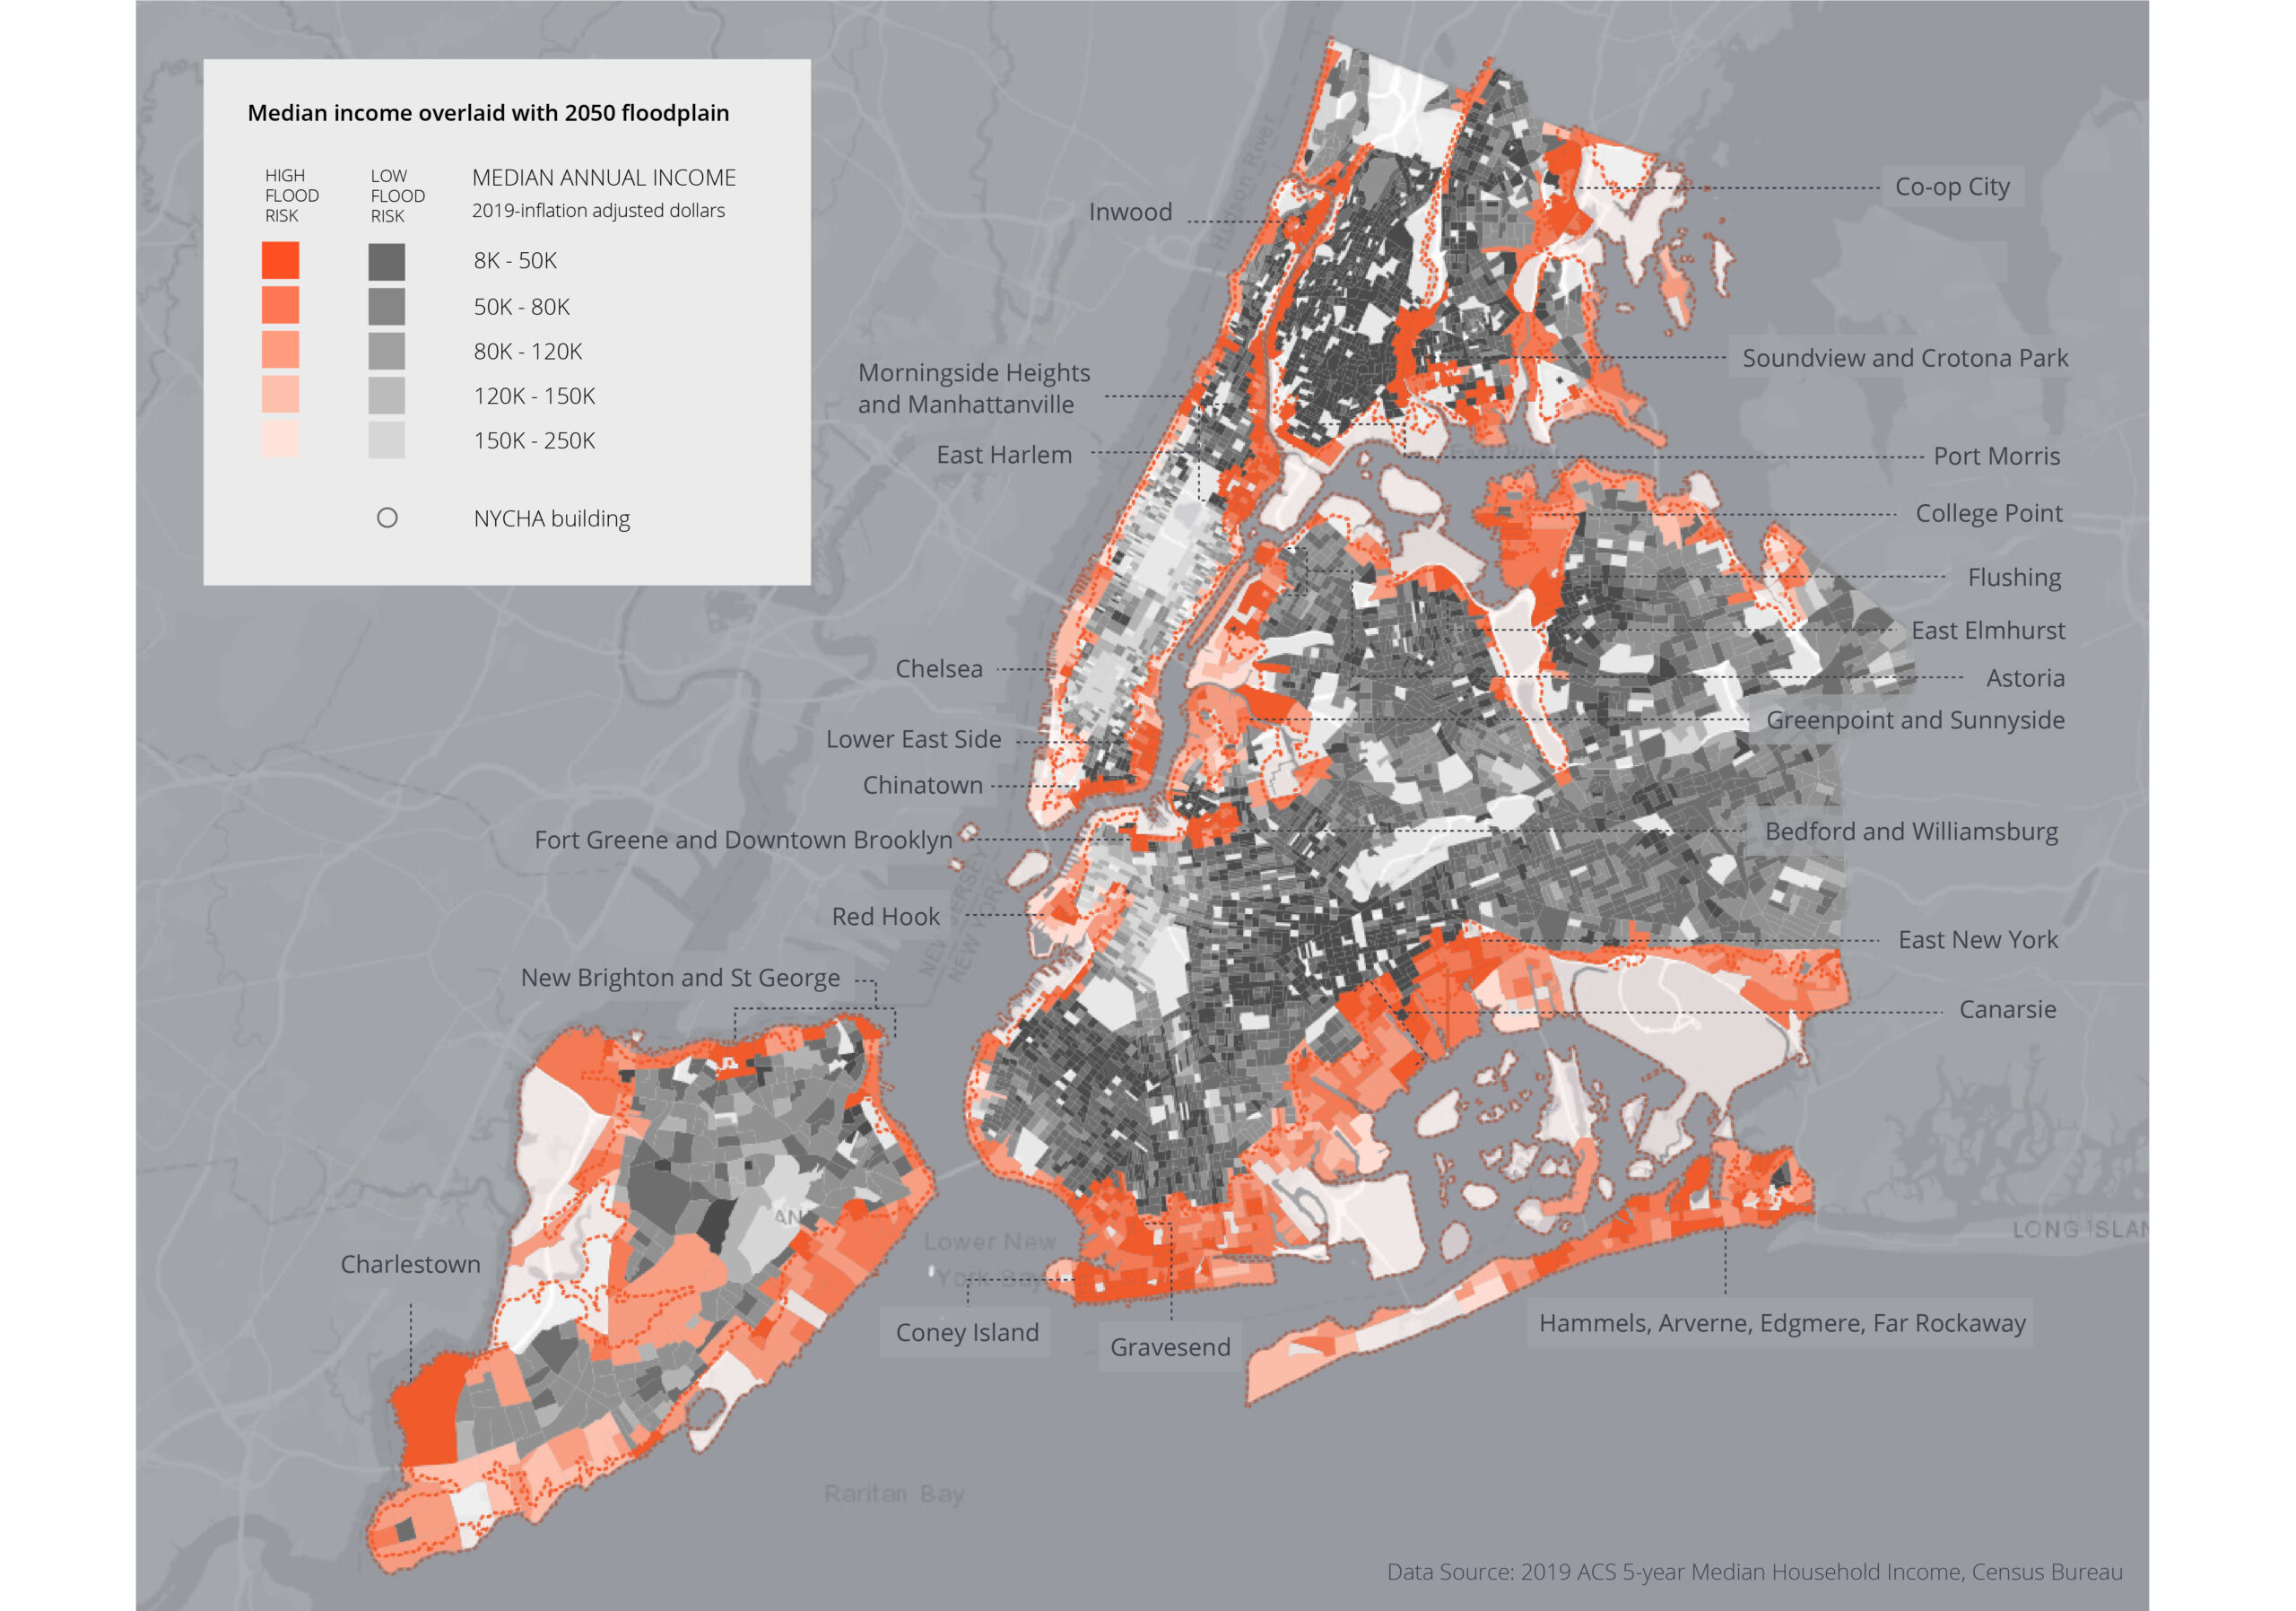
Many of the residents that live in and around NYCHA buildings earn less than 50K a year.
Some of the densest residential neighborhoods in the high risk floodplain are also the poorest: the Lower East Side, Chinatown, East Harlem, and Inwood in Manhattan; Fort Greene, Astoria, Coney Island, and the Williamsburg/Bedford junction in Brooklyn; Port Morris, Soundview, and Crotona Park in the Bronx; and Flushing and the eastern half of the Rockaway peninsula in Queens. Eleven out these thirteen areas contain NYCHA buildings. Tens of thousands of low-income New Yorkers also live in other less dense, non-NYCHA neighborhoods. These include College Point in Queens, Co-op City in the Bronx, Sunnyside in Brooklyn, and Charlestown, New Brighton, and St. George in Staten Island.
This is important because economic strain impedes environmental resilience. A limited income can make it more difficult to do things like buy flood insurance, evacuate, and relocate.
1. 2019 5-year ACS Block Group Level Data, Median Income Variable B19013
ACS API – Python notebook that pulls data
2. NYCHA Building Footprints, NYC Open Data
https://data.cityofnewyork.us/Housing-Development/Map-of-NYCHA-Developments/i9rv-hdr5
3. Borough geometries, NYC Department of City Planning
https://www1.nyc.gov/site/planning/data-maps/open-data.page#district_political
4. 2050 High Risk Floodplain, NYC Open Data
https://data.cityofnewyork.us/Environment/Sea-Level-Rise-Maps-2050s-100-year-Floodplain-/hbw8-2bah
5. 2010 Census block group shapefiles, NYC Department of City Planning
https://www1.nyc.gov/site/planning/data-maps/open-data.page#district_political
6. Neighborhood Tabulation Areas, NYC Department of City Planning
https://www1.nyc.gov/site/planning/data-maps/open-data.page#district_political
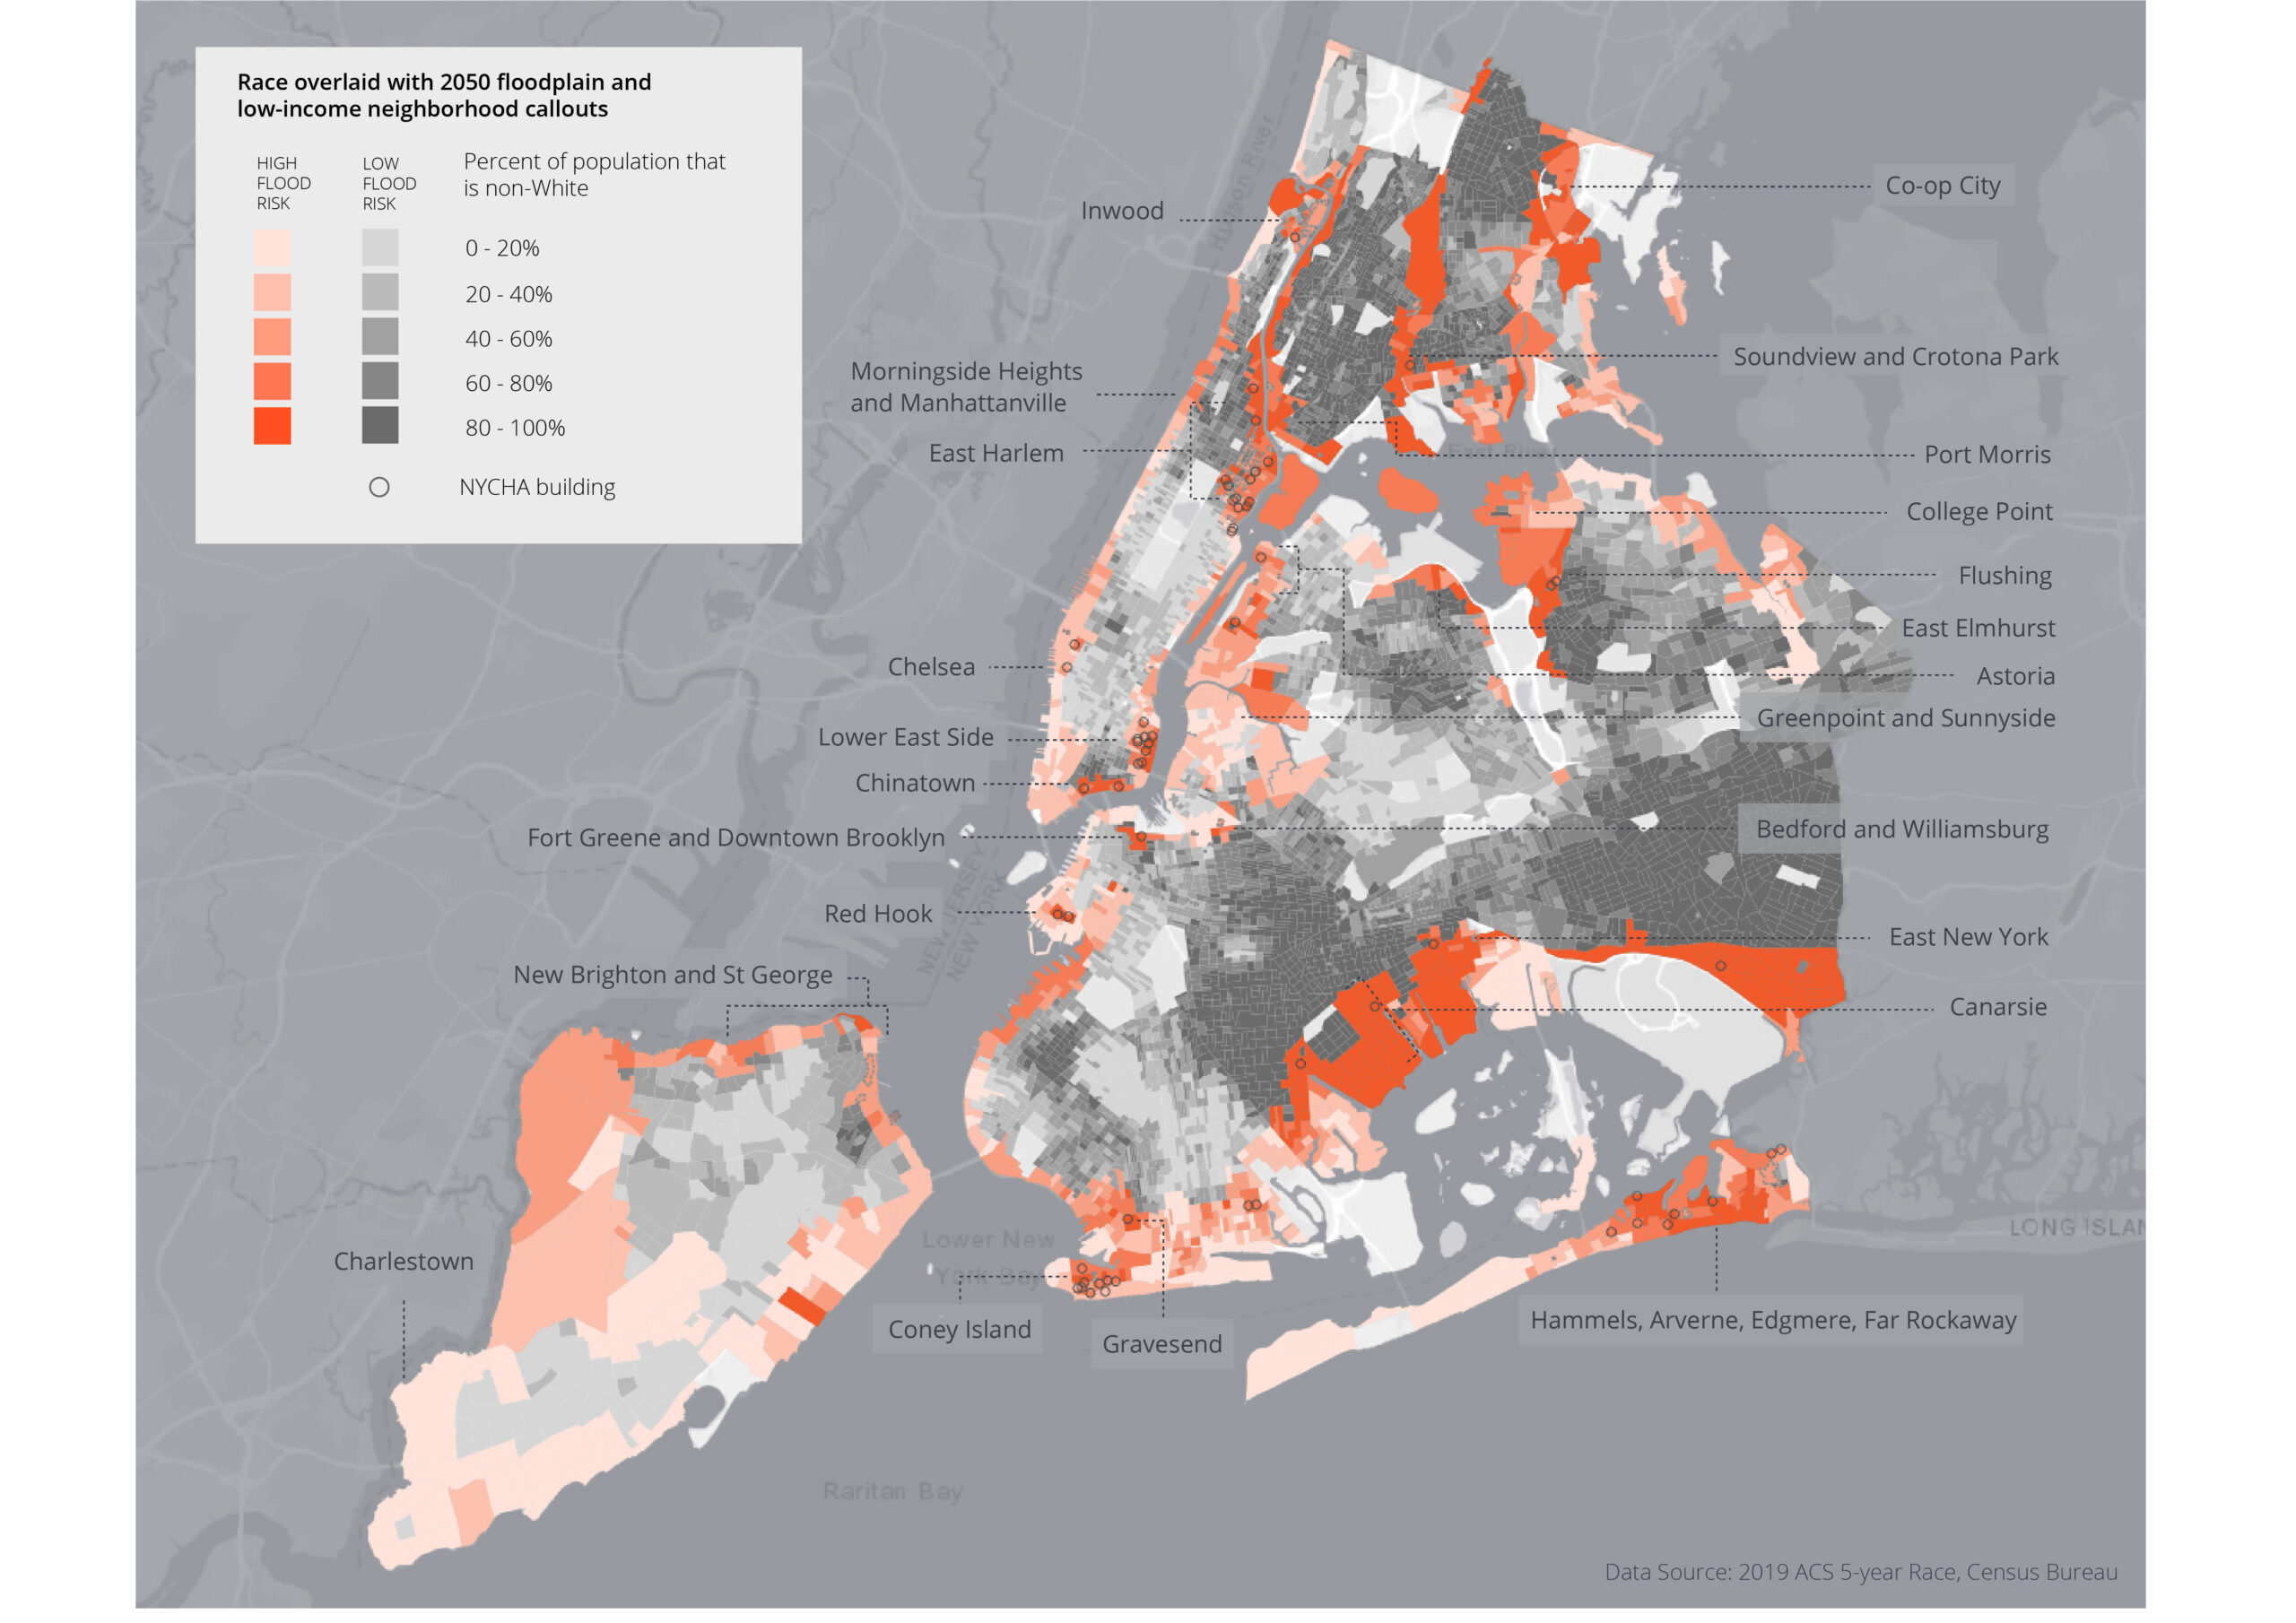
The economic burden is not shared equally.
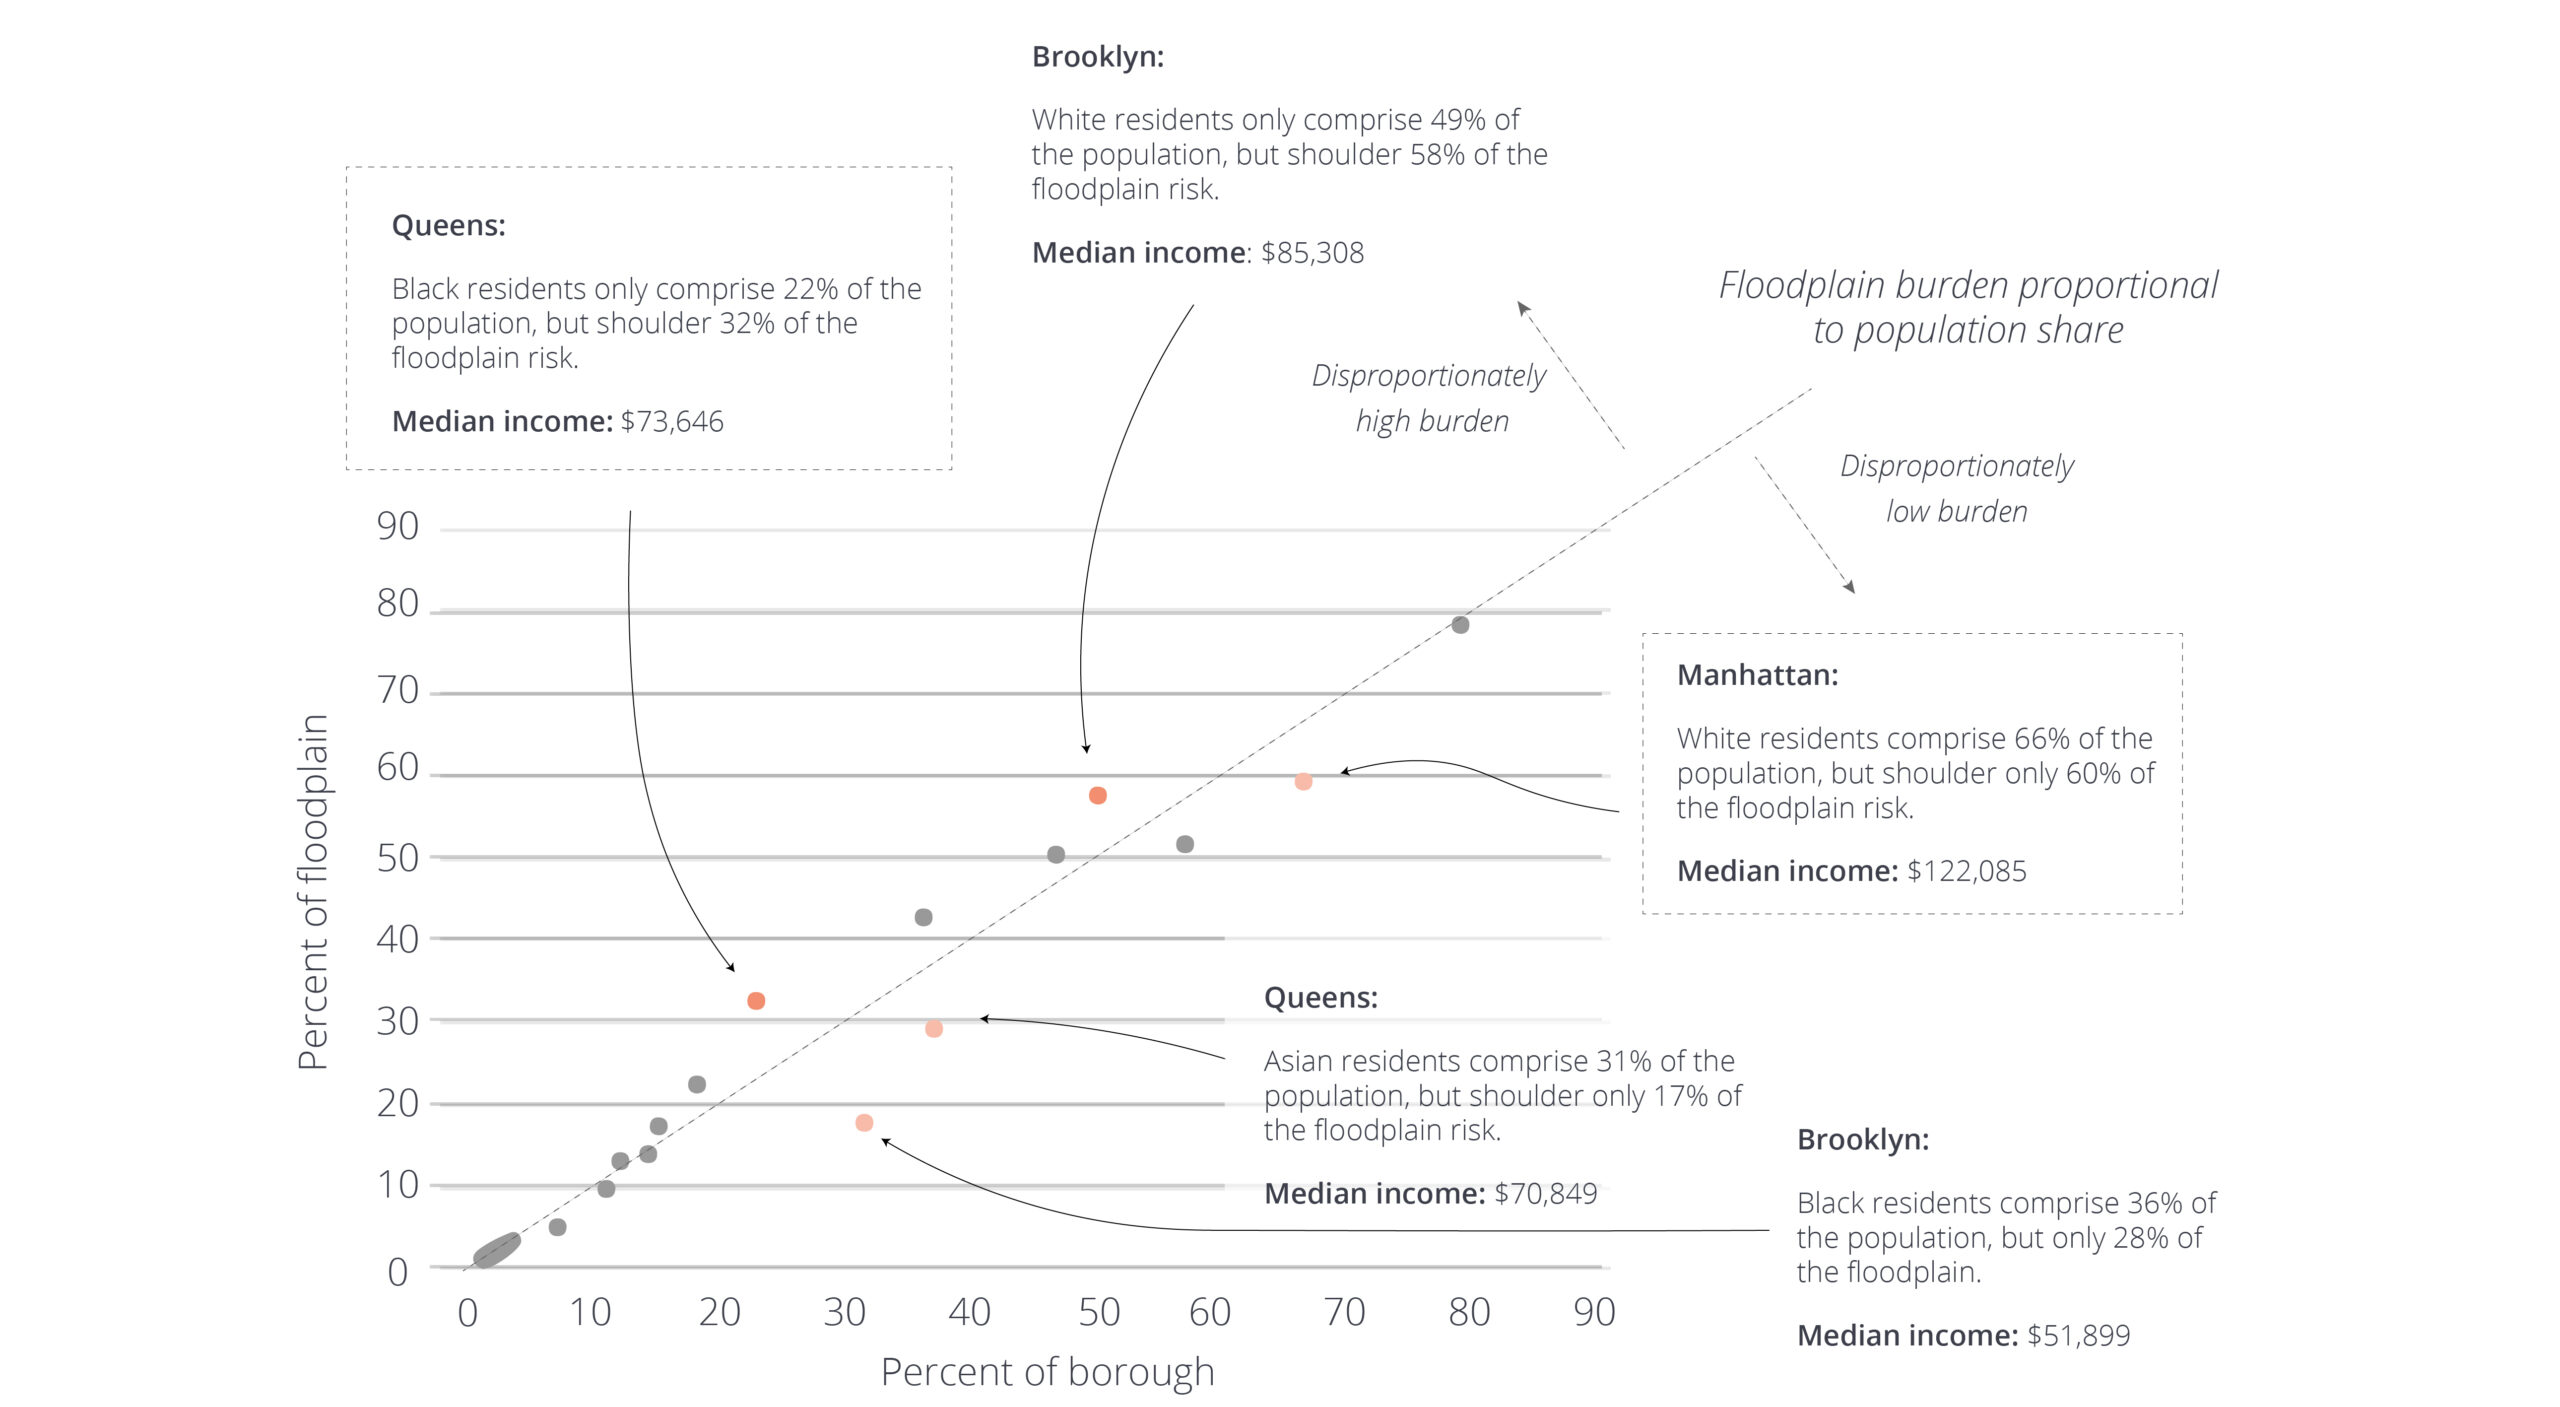
Overall the majority of floodplain residents are White, but Black New Yorkers still shoulder a disproportionately high share of the burden in some areas. They also earn less.
RAMP works with a variety of community based groups to reasearch the adverse effects of environmental change in New York. The map below show the diverse landscape of organizations in New York.


